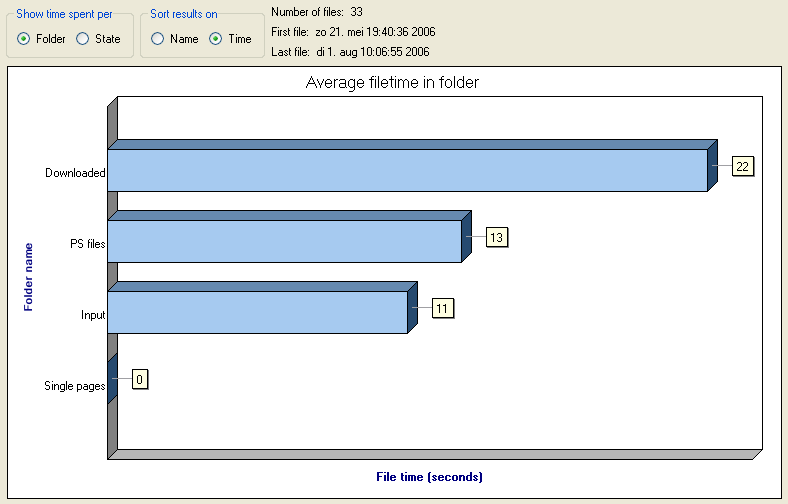
Switch offers five panes to monitor activity/ manage workload. These are:
- General load indicator pane
- Dashboard pane
- Progress pane
- Network activity pane and
- Jobs information pane
Using the above panes users can,
- Monitor Switch activity
- Inspect OS and Switch workload
- View processing statistics
- View state of Switch internal data
- Size of jobs queue
- The load for a specific element
- Number of script entry points currently running (grouped by types)
- Number of external processes currently launched with their CPU usage
- For each element: number of job waiting
- Sizes of log database, global data, temp folder
- Number of job tickets, datasets
- Number of currently connected Clients

For more information see Activity monitor and workload management.